The following is a tabular depiction of the
responses to
each survey question. Additional comments provided by respondents, if
any, are
included after each table.
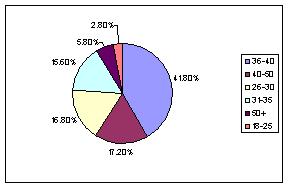
41.8% 36-40
17.2% 40-50
16.8% 26-30
15.6% 31-35
5.8% 50+
2.8% 18-25
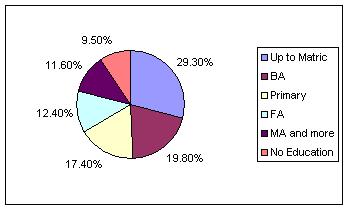
29.3% Up to Matric
19.8% BA
17.4% Primary
12.4% FA
11.6% MA and more
9.5% No Education
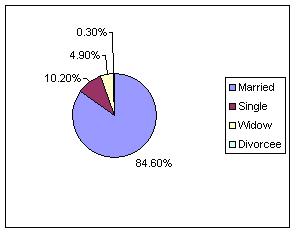
84.6% Married
10.2% Single
4.9% Widow
0.3% Divorcee
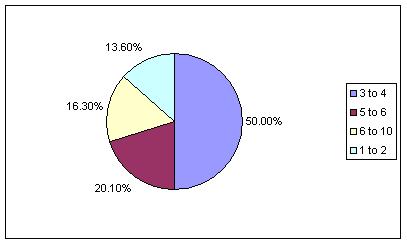
50.0% 3-4
20.1% 5-6
16.3% 6-10
13.6% 1-2
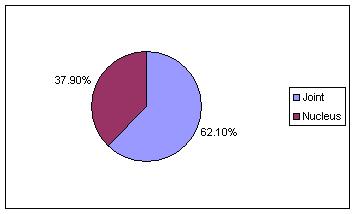
62.1% Joint
37.9% Nucleus
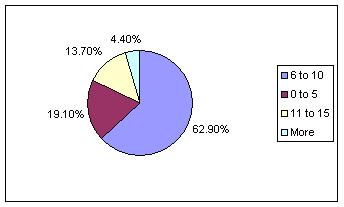
62.9% 6-10
19.1% 0-5
13.7% 11-15
4.4% More
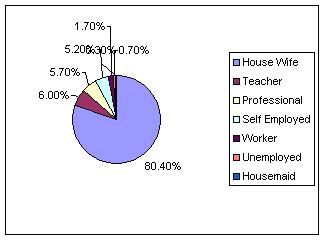
80.4% House Wife
6.0% Teacher
5.7% Professional
5.2% Self Employed
1.7% Worker
0.7% Unemployed
0.3% Housemaid
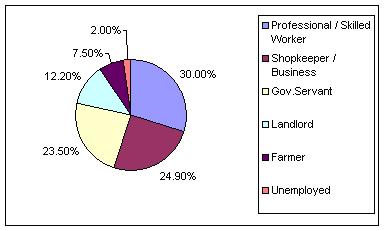
30.0% Professional / Skilled Worker
24.9% Shopkeeper / Business
23.5% Gov.Servant
12.2% Landlord
7.5% Farmer
2.0% Unemployed
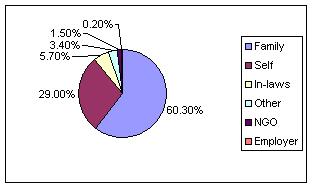
60.3% Family
29.0% Self
5.7% In-laws
3.4% Other
1.5% NGO
0.2% Employer
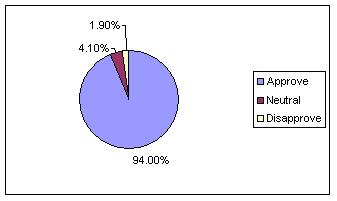
94.0% Approve
4.1% Neutral
1.9% Disapprove
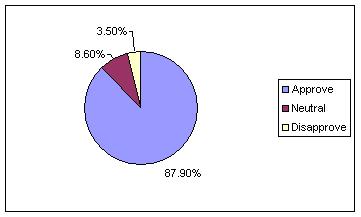
87.9% Approve
8.6% Neutral
3.5% Disapprove
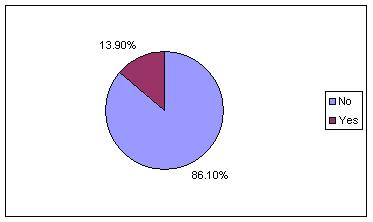
86.1% No
13.9% Yes
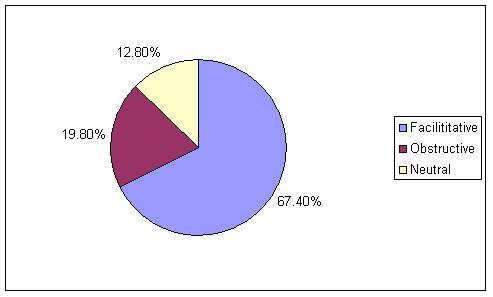
67.4% Facilitative
19.8% Obstructive
12.8% Neutral
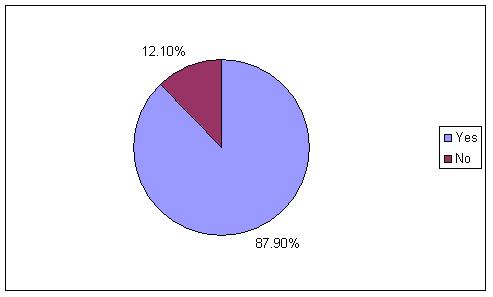
87.9% Yes
12.1% No
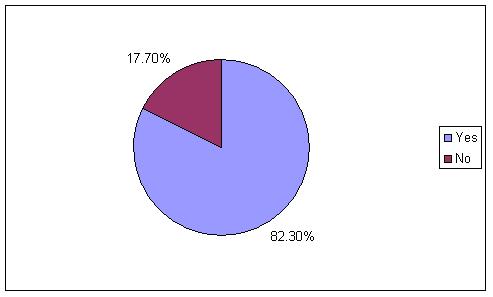
82.3% Yes
17.7% No
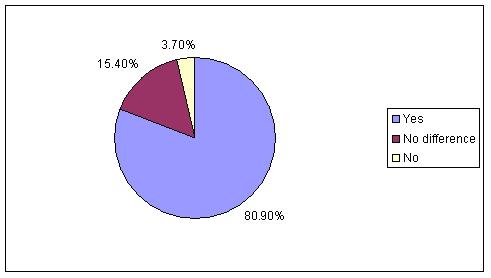
80.9% Yes
15.4% No difference
3.7% No
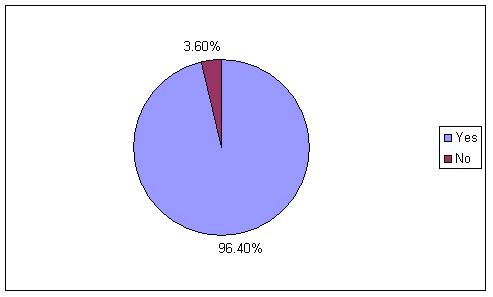
96.4% Yes
3.6% No
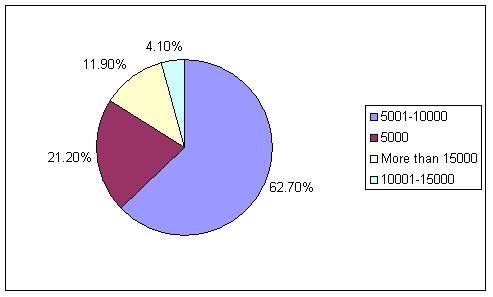
62.7% 5001-10000
21.2% 5000
11.9% More than 15000
4.1% 10001-15000
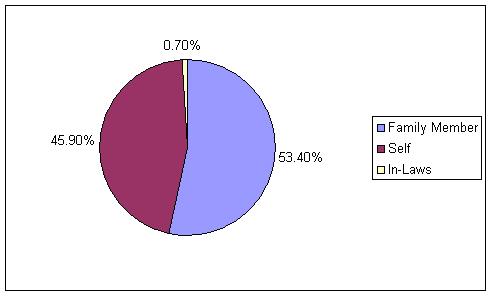
53.4% Family Member
45.9% Self
0.7% In-Laws
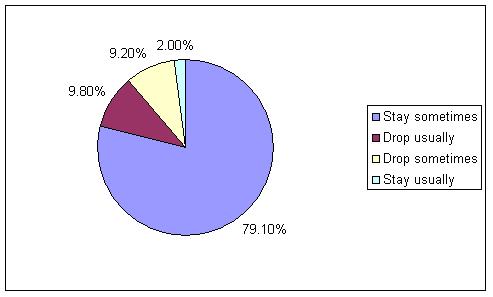
79.1% Stay sometimes
9.8% Drop usually
9.2% Drop sometimes
2.0% Stay usually
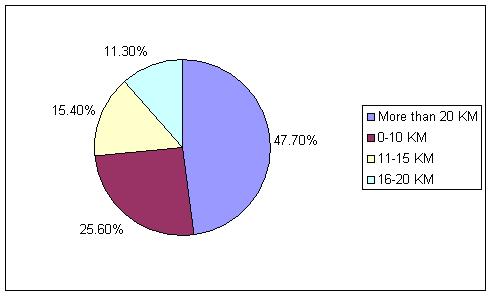
47.7% More than 20 KM
25.6% 0-10 KM
15.4% 11-15 KM
11.3% 16-20 KM
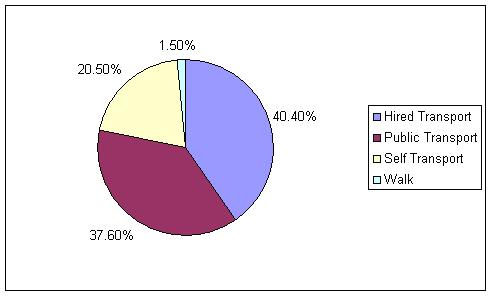
40.4% Hired Transport
37.6% Public Transport
20.5% Self Transport
1.5% Walk
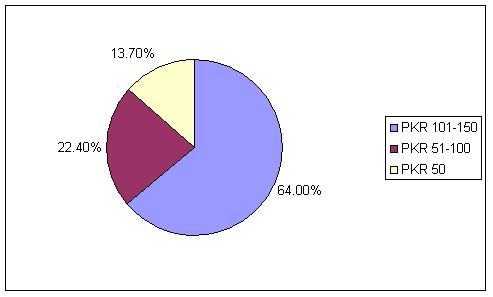
64.0% PKR 101-150
22.4% PKR 51-100
13.7% PKR 50
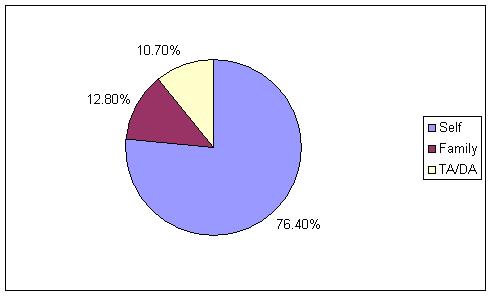
76.4% Self
12.8% Family
10.7% TA/DA
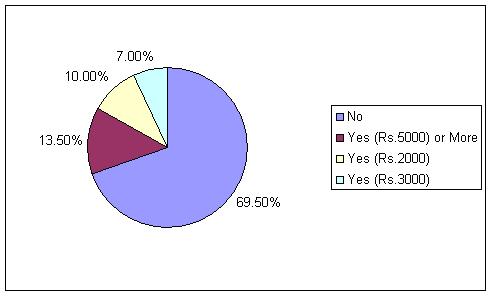
69.5% No
13.5% Yes (Rs.5000) or More
10.0% Yes (Rs.2000)
7.0% Yes (Rs.3000)
53.8% No
30.0% Yes (Rs.300)
16.2% Yes (Rs.200)

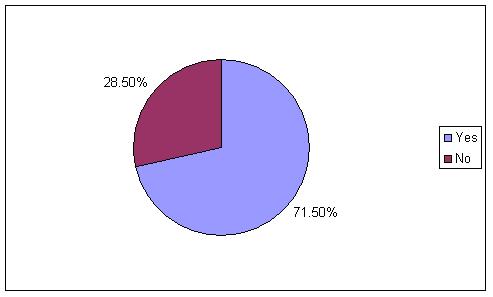
71.5% Yes
28.5% No
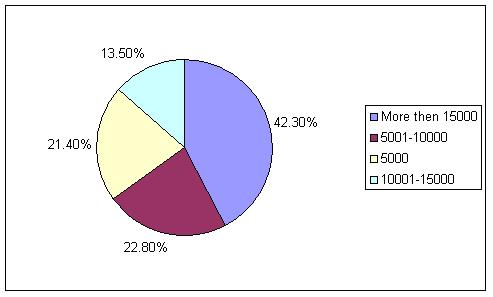
42.3% More then 15000
22.8% 5001-10000
21.4% 5000
13.5% 10001-15000
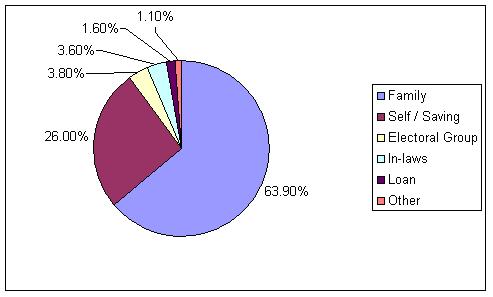
63.9% Family
26.0% Self / Saving
3.8% Electoral Group
3.6% In-laws
1.6% Loan
1.1% Other
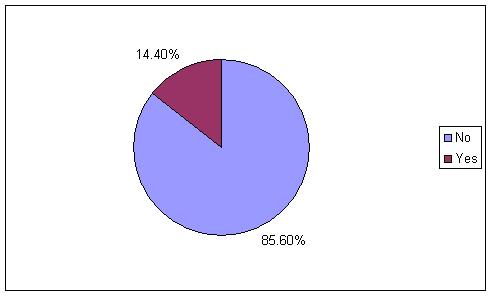
85.6% No
14.4% Yes
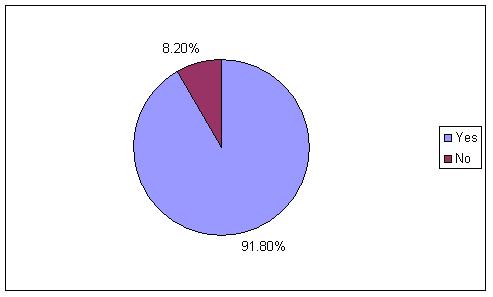
91.8% Yes
8.2% No
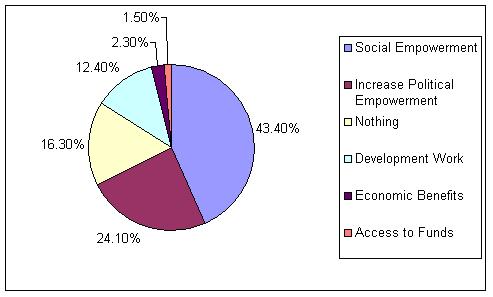
43.4% Social Empowerment
24.1% Increase Political Empowerment
16.3% Nothing
12.4% Development Work
2.3% Economic Benefits
1.5% Access to Funds
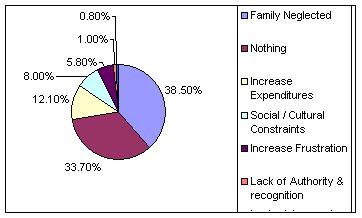
38.5% Family Neglected
33.7% Nothing
12.1% Increase Expenditures
8.0% Social / Cultural Constraints
5.8% Increase Frustration
1.0% Lack of Authority & recognition
0.8% Lack of Access to Funds
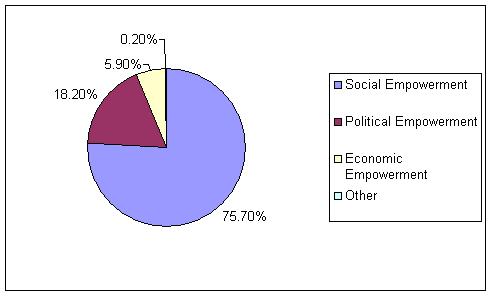
75.7% Social Empowerment
18.2% Political Empowerment
5.9% Economic Empowerment
0.2% Other
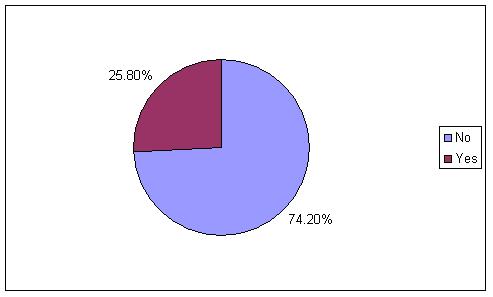
74.2% No
25.8% Yes
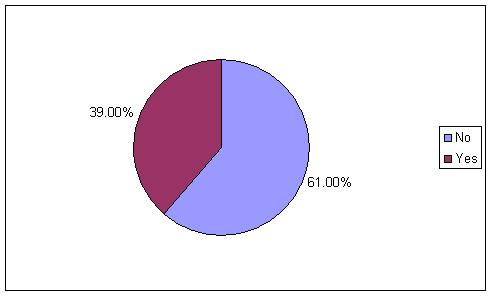
61.0% No
39.0% Yes
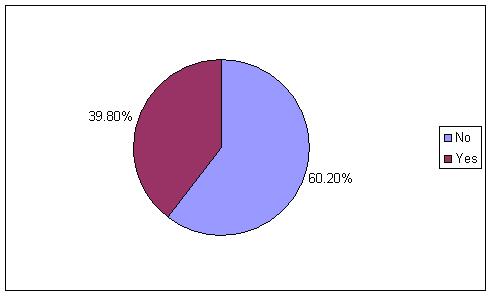
60.2% No
39.8% Yes
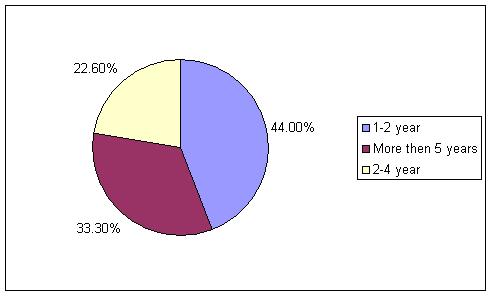
44.0% 1-2 year
33.3% More then 5 years
22.6% 2-4 year
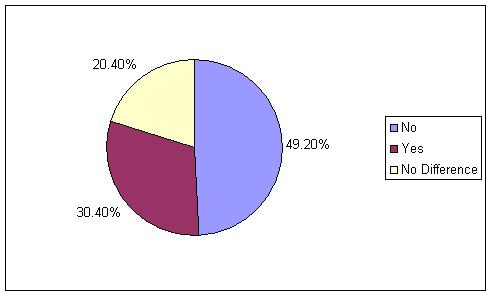
49.2% No
30.4% Yes
20.4% No Difference
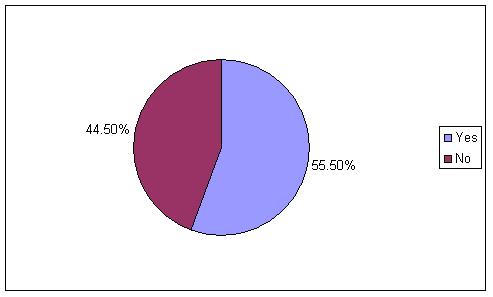
55.5% Yes
44.5% No
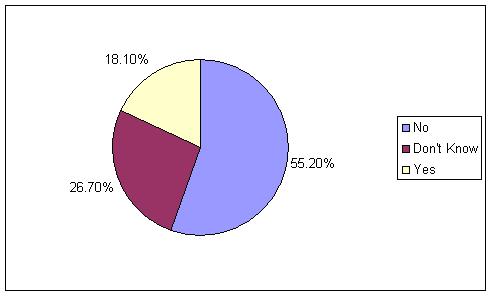
55.2% No
26.7% Don't Know
18.1% Yes
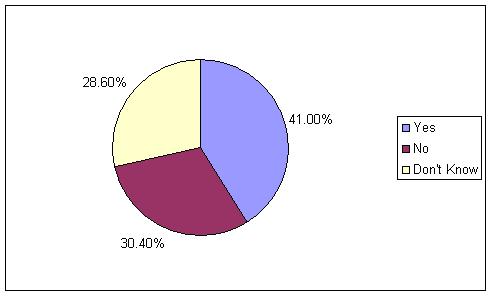
41.0% Yes
30.4% No
28.6% Don't Know
74.3% Yes
25.7% No

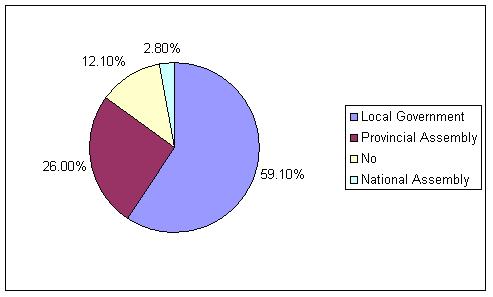
59.1% Local Government
26.0% Provincial Assembly
12.1% No
2.8% National Assembly
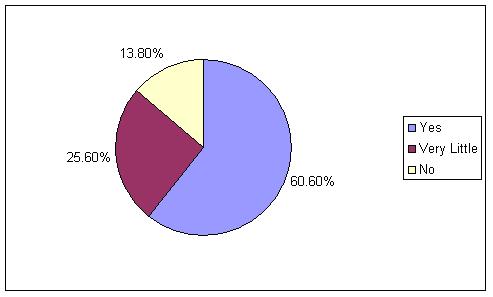
60.6% Yes
25.6% Very Little
13.8% No
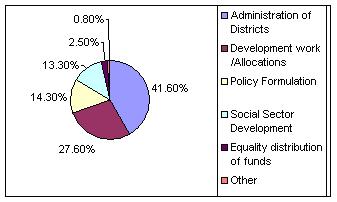
41.6% Administration of Districts
27.6% Development work /Allocations
14.3% Policy Formulation
13.3% Social Sector Development
2.5% Equality distribution of funds
0.8% Other
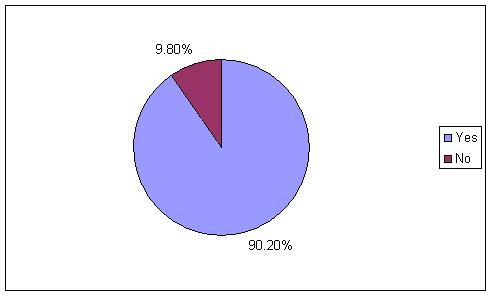
90.2% Yes
9.8% No
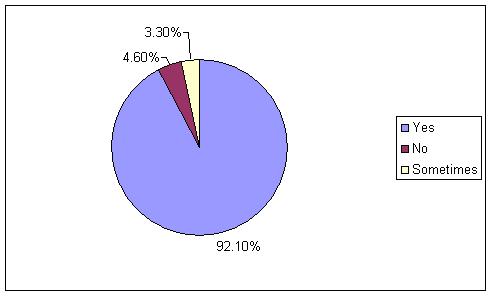
92.1% Yes
4.6% No
3.3% Sometimes
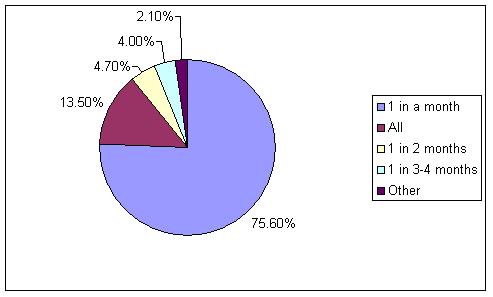
75.6% 1 in a month
13.5% All
4.7% 1 in 2 months
4.0% 1 in 3-4 months
2.1% Other
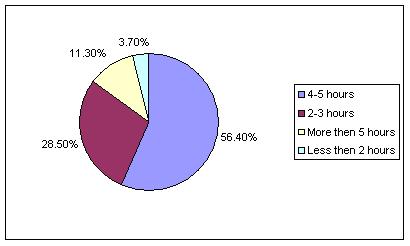
56.4% 4-5 hours
28.5% 2-3 hours
11.3% More then 5 hours
3.7% Less then 2 hours
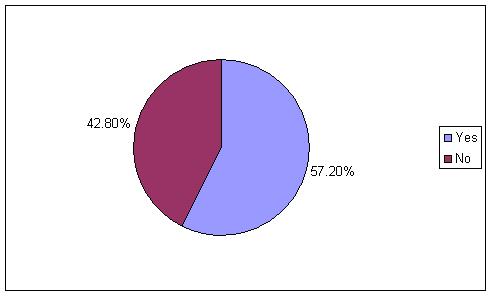
57.2% Yes
42.8% No
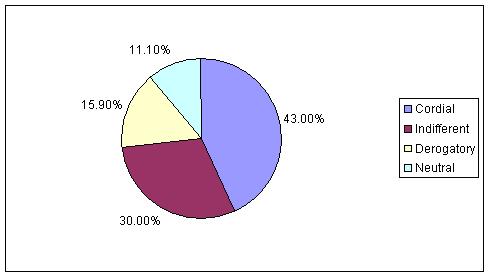
43.0% Cordial
30.0% Indifferent
15.9% Derogatory
11.1% Neutral
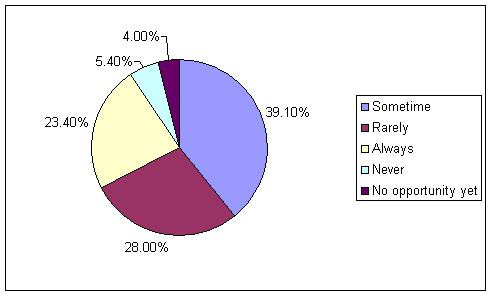
39.1% Sometime
28.0% Rarely
23.4% Always
5.4% Never
4.0% No opportunity yet
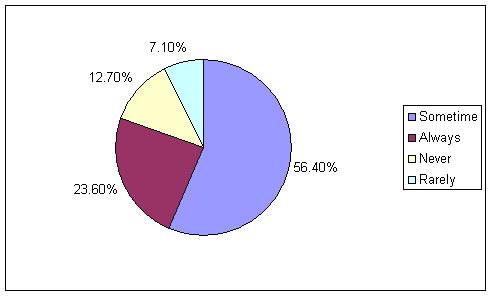
56.4% Sometime
23.6% Always
12.7% Never
7.1% Rarely
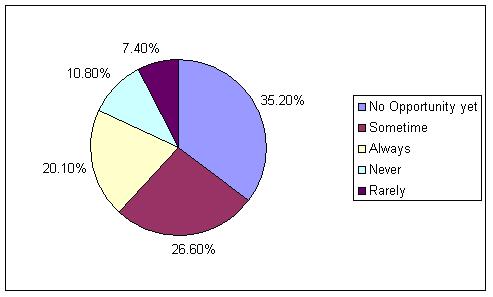
35.2%
No
26.6% Sometime
20.1% Always
10.8% Never
7.4% Rarely
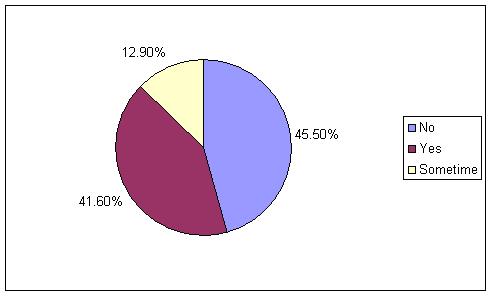
45.5% No
41.6% Yes
12.9% Sometime
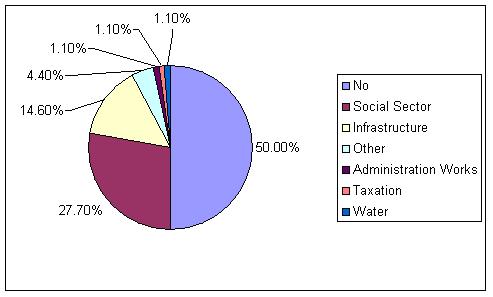
50.0% No
27.7% Social Sector
14.6% Infrastructure
4.4% Other
1.1% Administration Works
1.1% Taxation
1.1% Water
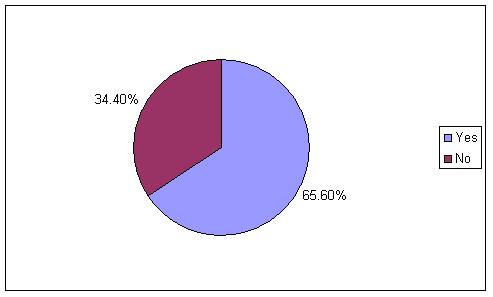
65.6% Yes
34.4% No
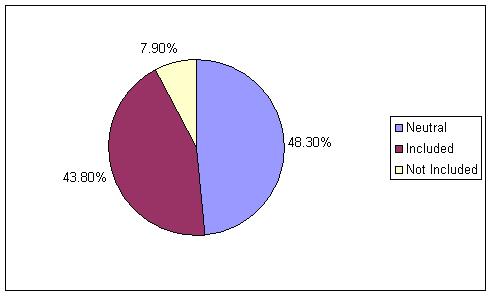
48.3% Neutral
43.8% Included
7.9% Not Included
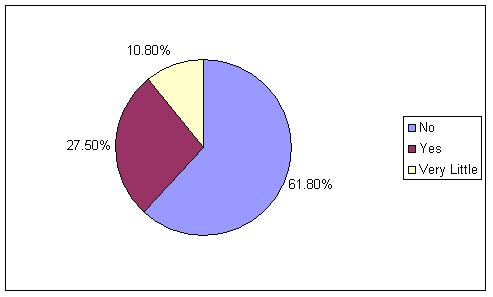
61.8% No
27.5% Yes
10.8% Very Little
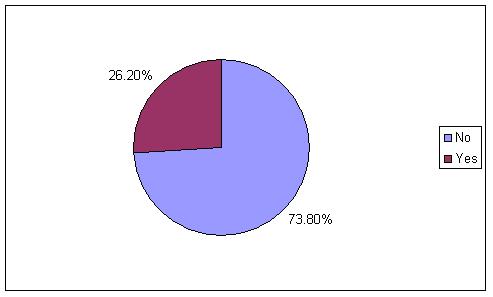
73.8% No
26.2% Yes
83.7% No
16.3% Yes

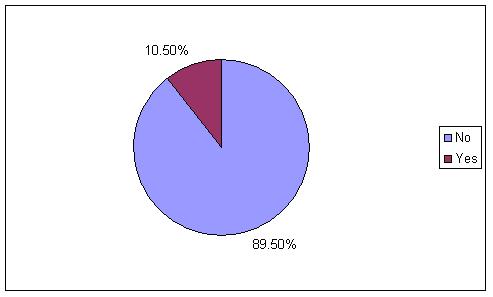
89.5% No
10.5% Yes
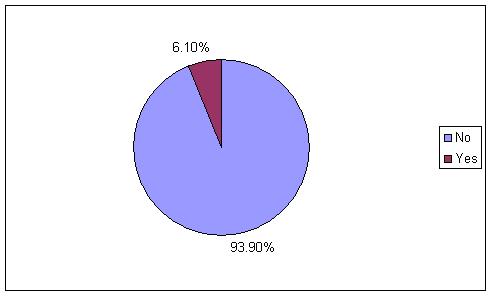
93.9% No
6.1% Yes
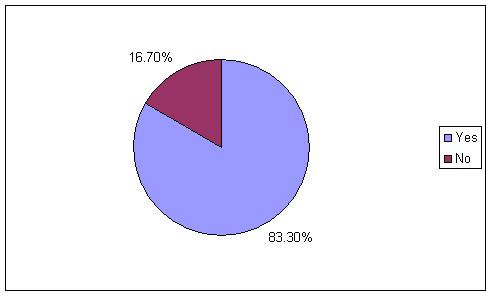
83.3% Yes
16.7% No
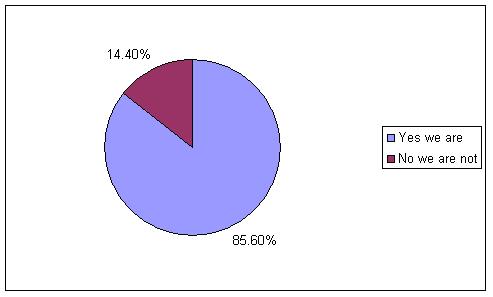
85.6% Yes we are
14.4% No we are not
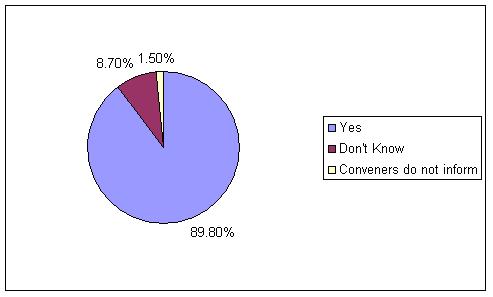
89.8% Yes
8.7% Don't Know
1.5% Conveners do not inform
66.8% No
33.2% Yes

97.9% Yes
2.1% No

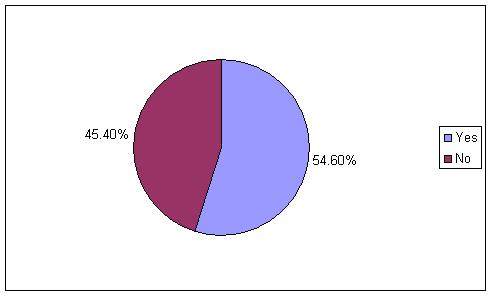
54.6% Yes
45.4% No
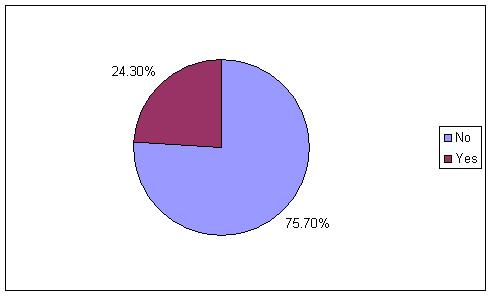
75.7% No
24.3% Yes
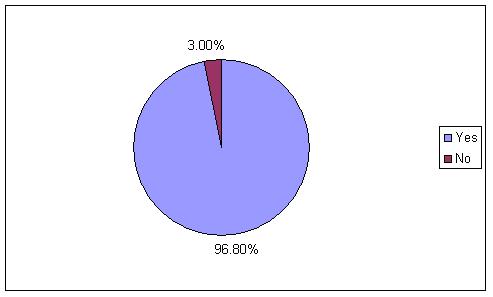
96.8% Yes
3.0% No
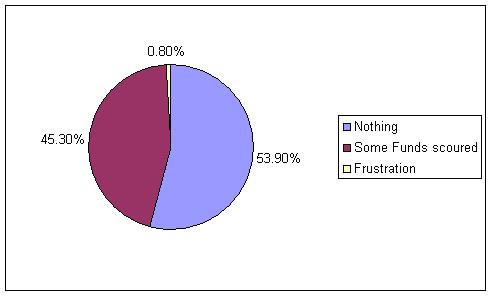
53.9% Nothing
45.3% Some Funds scoured
0.8% Frustration
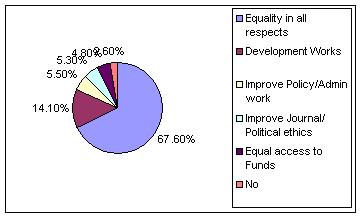
67.6% Equality in all respects
14.1% Development Works
5.5% Improve Policy/Admin work
5.3% Improve Journal/ Political ethics
4.8% Equal access to Funds
2.6% No
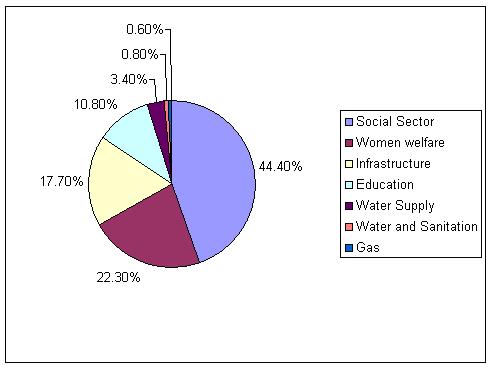
44.4% Social Sector
22.3% Women welfare
17.7% Infrastructure
10.8% Education
3.4% Water Supply
0.8% Water and Sanitation
0.6% Gas
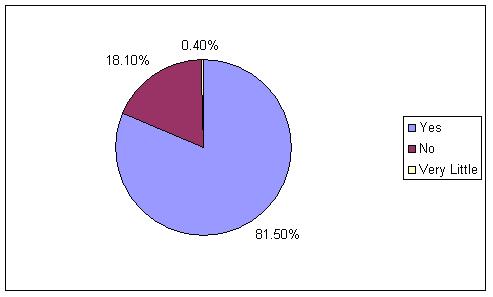
81.5% Yes
18.1% No
0.4% Very Little
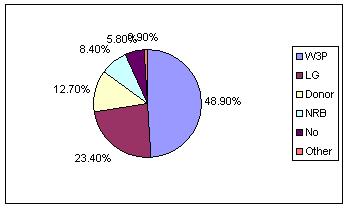
48.9% W3P
23.4% LG
12.7% Donor
8.4% NRB
5.8% No
0.9% Other
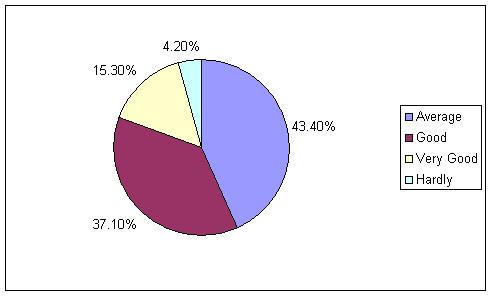
43.4% Average
37.1% Good
15.3% Very Good
4.2% Hardly
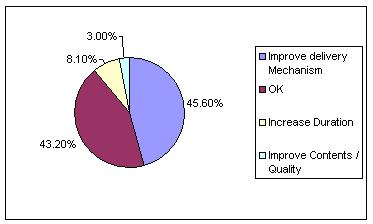
45.6% Improve delivery Mechanism
43.2% OK
8.1% Increase Duration
3.0% Improve Contents / Quality