In developing its approach to urban sustainability, the Expert Group endorses the following well-accepted definition of sustainable development presented in the Brundtland Report [1] :
“Sustainable development is development that meets the needs of the present without compromising the ability of future generations to meet their own needs.”
Sustainable development is thus a much broader concept than environmental protection. It implies a concern for future generations and for the health and integrity of the environment in the long run. It supports concern for maintaining the quality of life (not only the income growth), for equity among people of today (including the prevention of poverty), for inter-generation equity (people in the future deserve an environment which would at the least be as good as the one we currently enjoy), and for the social and ethical dimensions of human welfare. It also implies that further development should only take place as long as it is within the carrying capacity of natural systems. Evidently, addressing the sustainable development agenda provides new challenges for urban policy integration within holistic frameworks.
The following more practical and local interpretation of sustainable development, provided by the International Council for Local Environmental Initiatives [2] , is more useful if we seek to apply the concept in Europe's urban areas: “Sustainable development is development that delivers basic environmental, social and economic services to all residents of a community without threatening the viability of the natural, built and social systems upon which the delivery of these services depends.”
The main principles of sustainability are:
¨ The standard of living must be based on the carrying capacity of the natural environment.
¨ Sustainability must be based on social justice.
¨ Water and energy resources must not be consumed more rapidly than natural systems are able to replenish them.
¨ Non-renewable resources must not be consumed at a rate greater than the one that is necessary for the development of sustainable, renewable resources.
¨ The rates at which pollutants are emitted must not exceed the air, water and soil's capacity to absorb and process them.
¨ Maintenance of biodiversity is and must be a prerequisite for sustainability.
2. TOWARD SUSTAINABILITY
Analyzing the challenges that many cities were faced with in their efforts to achieve a more sustainable development, invariably give a high priority to the problems of mobility and access. At the urban level, where transport problems are more acute and concentrated than elsewhere, achieving a sustainable form of mobility is a prerequisite for the improvement of both the environment, including social aspects, and the economic viability.
A great deal of research has been conducted in recent years. The European Commission has addressed this issue in research documents and in the Green Paper on Impact of Transport on the Environment [3] . Dealing with urban mobility problems is now a priority in the EU's transport and environment policies as outlined in The Future Development of the Common Transport Policy [4] and the Fifth Environmental Action Program [5] . The Fifth Environmental Action Program identifies the impacts of transport on the environment as well as it specifies measures to reduce them. It sets out a time-scale for implementation and identifies the actors involved, including the EU, Member-States and local government.
Further steps have been taken by the European Commission through the publication of the Green Paper Towards fair and efficient pricing policy in transport [6] . This publication selects urban areas as targets for a new comprehensive policy response to ensure that prices reflect underlying deficiencies, which otherwise would not be taken into account seriously. The Green Paper Citizens' Network - Fulfilling the potential of public transport in Europe [7] emphasizes the essential role of public transport in improving the quality of life and the environment.
Through the Fifth Environmental Action Programme the EU recognizes that the approach to environment policy based on legislation, on which the EU has long relied, is characterized by a considerable gap between policy formulation and implementation preventing the achievement of sustainable development objectives. The Programme therefore adopts a new approach to tackling environmental problems and proposes new instruments. The key elements of the new approach involve integration - both internal integration between the various environmental issues and external integration of environmental objectives into other EU policies - and the concept of joint and shared responsibility for the environment between the EU and Member- States, along with other relevant partners, including local governments and municipalities.
In February 1993, The Fifth Environmental Action Programme, which sets the environmental agenda for the period 1993 to 2000 and beyond, was officially adopted. It was supplemented by a report on the State of Europe's Environment [8] . Compared to earlier environment programmes, the Fifth Programme is directed towards dealing with the root causes of environmental problems rather than with treating its symptoms. The aim of the Programme is to introduce changes in current trends and practices and ultimately to achieve change in patterns of human consumption and behaviour. The significant thing in this Programme is that transport and industry are identified as key sectors in which combined approaches to sustainable development must be adopted. In order to achieve many of the Programme objectives, The Action Programme also places considerable emphasis on the role of land use and strategic planning.
Local authorities in the European Cities and Towns Campaign have expressed growing interest in managing urban stress in Europe and CEE. This Europe-wide initiative currently involves over 400 European local authorities, from Reykjavik, Iceland to Corfu, Greece. Five international local authority networks are associated with the campaign: the Council of European Municipalities and Regions, Eurocities, the Healthy Cities Network of the World Health Organization, the United Towns Organization and the International Council for Local Environmental Initiatives [9] . The EU's environmental directorate, DGXI, provides the main funding support. The main goal of the campaign is to increase the number of sustainable cities among EU's members through Local Agenda 21 actions. Local Agenda 21 is a plan for keeping future economic development of a municipality in harmony with its environmental and social needs and limitations.
The importance of Local Agenda 21 for cities and towns was emphasized in its 28th Chapter, the document evolving from the 1992 UN World Environment and Development Conference. Chapter 28 states that "local authorities in each country should have undertaken a consultative process with their population and achieved a consensus on a Local Agenda 21 for their community" by 1996.
The European Cities and Towns Campaign was launched in May 1994 at the First European Conference on Sustainable Cities and Towns in Aalborg, Denmark. Eighty authorities signed the Aalborg Charter, committing themselves to long-term action plans toward sustainability and implementation of Local Agenda 21 processes. Twenty-nine CEE and NIS municipalities have so far signed the Aalborg Charter from Tirana, Albania to Tartu, Estonia.
The Second European Sustainable Cities conference was held in Lisbon in 1996, bringing in over 1000 local and regional representatives who were evaluating progress made since Aalborg and who agreed on the Lisbon Action Plan.
In Lisbon, they also came to a decision to hold four regional conferences between 1998-99. The purpose of these conferences would be to better understand the specific urban problems of the northern, southern, eastern and western European regions. The first was held in September 1998 in Turkey, Finland, and all Baltic cities agreed to begin Local Agenda 21 actions before 2000. The second conference, covering CEE, southeastern Europe and NIS, was held in Sofia, Bulgaria. The Mediterranean region was covered in January 1999 in Seville, Spain. Western Europe will be assessed this summer in The Hague, Netherlands. The Third Pan-European Conference was held in February 2000 in Hanover, Germany. Conference participants wrote a set of priority issues and recommendations that would guide their sustainable development work into the future. The conference was also a chance for CEE and NIS cities and towns to talk about the problems and strategies they have in common.
In 1994, Aalborg hosted the First European Conference on Sustainable Cities & Towns at which the Aalborg Charter was signed. The Charter is compounded from some kind of statement of demands for Agenda 21 deriving from the 1992 Rio Declaration. By September 1996, 245 local authorities from 27 European countries, representing more than 80 million European citizens, had signed the charter. They committed themselves to enter the Local Agenda processes and to develop local long-term action plans towards sustainable development.
· International action for sustainable cities
In 1987 eleven European cities became the founding members of the World Health Organization’s Healthy Cities Project. Thirty-five European cities now lead a much-extended Healthy Cities movement, and its principal aim is the improvement of living conditions in cities. The strategic management approaches and mechanisms developed by Healthy Cities, with their strong emphasis on community partnership, networking and the innovative use of indicators and targets are of particular relevance for the European Sustainable Cities Project. The WHO Global Strategy for Health and Environment [10] is closely linked to Agenda 21and makes strong connections between health, environment and development.
In 1990 the United Nations Centre for Human Settlements (Habitat) launched its Sustainable Cities Programme. Its principal goal was to provide municipal authorities in developing countries "with an improved environmental planning and management capacity which will strengthen their ability to define the most critical environmental issues, to identify available instruments to address these issues, and to involve all those whose cooperation is required in concerted and practical action" [11] . The Programme was designed to promote the sharing of expertise among cities in different regions of the world.
In September 1990, representatives of more than 200 local authorities from all parts of the world founded the International Council for Local Environmental Initiatives [12] . This Council was founded at the UNEP- and IULA-sponsored World Congress of Local Governments for a Sustainable Future held at the United Nations in New York. As a network of local authorities, ICLEI facilitates the exchange of experience among cities, towns and counties and broadcast examples of good environmental practice worldwide. ICLEI is also facilitating the Local Agenda 21 Model Communities Programme.
In August 1991, one hundred and thirty cities signed the Toronto Declaration on World Cities and their Environment, committing their cities to the preparation of sustainable development plans.
In May 1992, forty-five cities were taking part in the World Urban Forum, one of the events associated with the UNCED conference. They signed the Curitiba Commitment for sustainable urban development. In many ways the Curitiba Commitment provided a detailed action plan that individual cities could follow in drawing up action plans for sustainable development in consultation with their local communities.
The European Sustainable Cities Project is closely linked to other ongoing programmes addressing urban environment/development relationships, including, for example, the UNDP/World Bank/UNCHS Urban Management Programme and the UNDP/World Bank Metropolitan Environmental Improvement Programme. One of the outputs that is of a particular interest to the European Sustainable Cities Project is the guide to the preparation of city environmental strategies that was being prepared by the World Bank as well, in cooperation with UNDP and UNCHS, as defined in the paper Toward Environmental Strategies for Cities [13] .
The OECD's Urban Programme aims to improve understanding of the urban areas ecosystems, to evaluate examples of good practice in urban environmental improvement and to assess the effectiveness of integrative policies by local authorities and by other agencies in the public, private and voluntary sectors at various levels of government. A number of general policy principles and guidelines have emerged from this programme, all of them being of relevance to this report.
The OECD publication Environmental Policies for Cities in the 1990s [14] , significant for demonstrating the strength of international concern for environmental issues in cities, also progressed towards developing a set of operational principles for environmentally-sound urban management. More recently, the OECD Environment Group on Urban Affairs has agreed upon a working programme in the period 1994-95 on The Ecological City, which was of particular relevance to the European Sustainable Cities Project. This project is principally concerned with policy and processes development. Among the objectives are the explanation of the meaning of sustainability for cities and the methods by which it can be carried on. So far, the results of this programme suggest approaches similar to the proposals in this report.
The UN Conference on Environment and Development [15] , held in June 1992 in Rio de Janeiro, focused the world's attention on the need to promote sustainable development on a global scale. The EU played a leading role in the negotiations at Rio, and the EU and all Member- States signed the Framework Convention on Climate Change and the UN Convention on Biodiversity. The Framework commits them to taking actions in order to return the carbon dioxide and other "greenhouse gases" emission to their 1990 levels by 2000, and the UN Convention on Biodiversity sets up a framework for international cooperation to protect the world's species and their habitats.
In June 1993, the European Council of Ministers adopted a Decision for a monitoring mechanism of Community carbon dioxide and other greenhouse gas emissions. The Decision requires that all Member States devise, publish and execute national programmes for limiting their carbon dioxide emission in order to contribute to the realization of the commitment from the UN Framework Convention on Climate Change, as well as to the Community’s own objective to stabilize carbon dioxide emission in the year 2000. The Commission is responsible for the evaluation of the national programmes in order to assess whether progress in the Community as a whole is sufficient to guarantee fulfillment of the two commitments mentioned above [16] .
In addition, all Member-States committed themselves to the Rio Declaration on Environment and Development (The Earth Charter) and to Agenda 21, a detailed action plan setting out specific initiatives that nations should undertake. It appeals to governments to prepare national strategies for sustainable development and requires from them to submit progress reports to the UN Commission on Sustainable Development [17] . This Commission was established in 1993 to monitor progress in executing the agreements reached at Rio. The summary of the CSD and of the work that has been done on sustainable development by international agencies (including, for example, the World Bank, the World Health Organization and the Food and Agriculture Organization) is presented in Bigg [18] .
As part of their follow-up to UNCED, Member- States made a commitment at the European Council meeting in Lisbon in June 1992, to create national action plans for the implementation of Agenda 21. This was an act additional to the commitment to prepare national reports for the CSD. In their sustainable development plans, Member- States need to have regard for the Fifth Environmental Action Programme that provides many of the policy and financial instruments needed to fulfill the Rio commitments.
Unlike the Conventions, which become legally binding once the signatures are ratified, Agenda 21 is not a legally binding agreement. However, its influence is considerable and there is not enough space in this report to represent fairly the large volume of work that is being done worldwide under its auspices. Within Agenda 21, the concern is not limited only to the physical environment. World trade, poverty, population growth, health, and international cooperation and coordination are among the addressed topics. There are forty chapters, each of which includes a statement of objectives, an outline of required actions, guidelines for developing a framework for action, necessary institutional conditions, and the means of implementation, including finance.
Much of Agenda 21 has relevance to the urban environment. For example, the promotion of sustainable urban economies, land use and management are strongly featured. There is also a requirement to integrate transport and spatial planning. Local governments are given a key role in ensuring implementation of the Agenda 21 commitments. A summary of the main points of interest to local government is presented in LGMB, 1992b. Chapters 7 (Sustainable Human Settlements) and 28 (Local Authorities) are of particular importance. Chapter 28 sets out targets for local authorities saying that by 1994 "representatives of associations of cities and other local authorities should have increased levels of cooperation and coordination with the goal of enhancing the exchange of information and experience among local authorities" [19] . By 1996, local authorities should have "undertaken a consultative process with their populations and achieved a consensus on Local Agenda 21" [20] .
Networking acquired a higher profile during the 1980s, with the European Commission encouraging the efforts to foster economic and social cohesion between regions. Commission support has particularly increased since 1991, with the development of the RECITE initiative [21] .
Several existing European local government networks have an environmental dimension or have been established according to the policy areas picked out for detailed examination in this report. The Eurocities network (representing large cities) and the Commission de Villes (representing smaller and medium sized cities and towns) are wide-ranging, fostering initiatives in, for example, environmental action, transport, economic development and urban renewal. More specialized networks include, for example, Energy Cities in the field of urban energy management, Environet in the field of economic development; ECOS, POLIS, Public Transport Inter-change and the Car Free Cities Club in transport; and ROBIS, which deals with the recycling of land for residential and commercial development, in the area of spatial planning.
Networking for sustainable development is specifically mentioned in Agenda 21, and relevant examples of international cooperation between cities were outlined earlier in this chapter. Building institutional capacity as well as sharing ideas and technical know-how are the important aspects of networking for sustainability. Some existing European networks, such as Eurocities, have recently taken steps to focus on sustainability objectives. New networking arrangements are also being established. For example, as an input to the implementation of the Climate Change Convention, ICLEI has initiated a Cities for Climate Protection Campaign. To join, cities must commit to a local action plan to reduce greenhouse gases emission. In March 1993, eighty-three European cities started the European Cities for Climate Protection Campaign in Amsterdam. Some 360 European cities are members of the Climate Alliance of European Cities together with the Indigenous Rainforest Peoples of the Amazon. The member-cities were obligated to reduce CO2 emissions and to end their use of CFCs and tropical timber.
The European Sustainable Cities and Towns Campaign, based on the Aalborg Charter, was launched in May 1994 and was supported by major European networks of local authorities, including CEMR, Eurocities, ICLEI, UTO and WHO. Its aims are to promote development towards sustainability at the local level by encouraging cities to enter Local Agenda 21 as well as some similar processes, and to provide assistance for cities that are developing their long-term environmental action plans towards sustainability. Activities of the Campaign, together with the work of Expert Group on the Urban Environment on policy for sustainable cities, form the principal components of this European sustainable cities project funded by the Environment Directorate of the European Commission. A second European Conference on Sustainable Cities and Towns was held in Lisbon, Portugal, in October 1996.
Local Agenda 21 is essentially a strategic process of encouraging and controlling sustainable development. The development, management and implementation of this process require all the skills and tools that would be supported by a local authority and its community. Knowing that local authorities do not have much experience with such strategies, it is clear that they need advice in defining the tools and management systems that are most appropriate for achieving progress.
3. KEY SUSTAINABILITY ISSUES
3.1. Movement in cities
Mobility is essential to the livelihood of cities. However, the reached saturation levels of traffic, due to the dominance of the private car, are diminishing the efficient functioning of many cities by reducing accessibility and damaging the environment in the long term. Over the past forty years, patterns of urban change in Europe have led to significant changes in the way that people travel and the distances that are traveled in urban areas. Development and lifestyle changes have encouraged the alienation of resident and business areas. This has resulted in a great increase of traffic flows and a dramatic shift in modes of transport, from walking, cycling and public transport to the private car. In many cities in the EU the car accounts for over 80% of urban mechanized transport.
As for the future, the total annual number of kilometres per car in the EU is expected to increase by 25% between 1990 and 2010. During the same period of time, road haulage is expected to increase by 42% and rail freight increasing by only 33% the same period. Traffic expansion on a large scale would jeopardize the Union's ability to meet the concluded environmental targets about the quality of air, greenhouse gas emissions and the protection of landscapes. To achieve a more sustainable form of urban mobility and to improve accessibility, it will be necessary to reduce transport in the long run. Among other things, it will be necessary to minimize or even stop the predicted growth in the number and length of journeys and therefore minimize the transport demand in the short run.
Existing policies, which seek to influence competition between transport modes in urban areas, may not encourage individuals to take environmental impacts into account when making decisions about urban travel. It is incorrect to assume that individuals make rational choices based only on their own disposition for particular modes and destinations. The character and availability of competing systems are strongly influenced by the policies of central and local government. Current policies tend to encourage competition but they often put particular modes at a disadvantage, for example the modes in which levels of investment are insufficient.
In certain urban areas, the limitations of sustainability have already been exceeded from both an environment and a transport point of view. Movements into and within many cities and towns are becoming even more difficult and sometimes unsafe. Increasing air and noise pollution adds difficulties to congestion, making city travel unpleasant, lessening the quality of life and increasing health risks to a part of the population. The evidence emerges to show that, over a long period of time, unsustainable and inefficient mobility will have a damaging effect on the economy of our cities.
3.2. Environmental problems
· "Conventional" emission (air pollution)
Transport is now the major source of the air pollutants found in European cities. Road traffic is mostly responsible for the high level of summer smog in Europe, and World Health Organization guidelines for ozone, NOx and CO emissions have been violated on numerous occasions. Surveys show that, for example, in 70-80 % of European cities with more than half a million inhabitants, air pollution levels exceed these WHO guidelines at least once year. In some southern European cities levels of air pollution are at times so high, that traffic restrictions or bans are introduced for certain days or for a certain period of the day.
Although the recent and approaching legislation on exhaust emissions of cars and lorries will result in substantial reduction of pollution from individual vehicles, the projected increase in vehicles and kilometres will, over the medium term, largely offset the potential reductions. Therefore, there is a general agreement that technology alone will not solve the air pollution problems caused by transport.
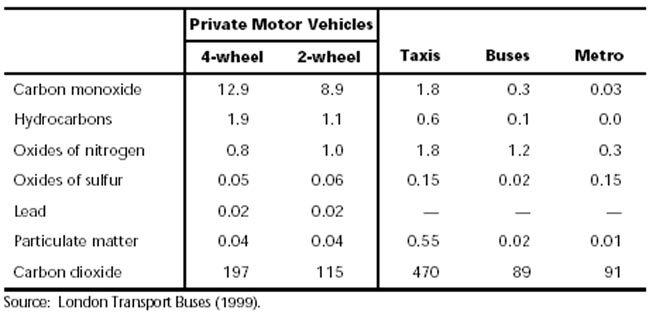
Private-vehicle travel tends to generate larger amounts of emissions per unit distance traveled than public transport modes (Table 1), but this is probably too general a statement to be of much value in any specific local circumstances. Clearly, many other factors are involved, including average vehicle occupancy rates, the age and maintenance level of the respective vehicle fleets, and so on. The technologies for reduction of emissions from spark-ignition (i.e., gasoline powered) engines were first introduced in the United States and Japan in the late 1960s. Europe followed with similar regulations a decade later. Standards for exhaust emissions, and for evaporative emissions of VOCs from vehicle fuel systems, have become more rigorous and are scheduled to continue that trend. In the most strictly controlled regions, emissions from new vehicles are 90% to 98% lower than they were prior to the control. This step-by-step regulatory approach is followed in other parts of the world as well, though with some delay.
Table 1. – Emission rates in London (grams/passenger-km) by mode, 1997.
The emissions from vehicles powered by compression-ignition (i. e. diesel) engines (including trucks, off-road construction vehicles, railroad locomotives and waterborne vessels) were earlier less strictly regulated than emissions from gasoline engine vehicles. In part, that was because exhaust treatment technologies — catalysts for NOx, traps for particulates — were not sufficiently developed to enable their widespread use.
The adoption of more effective abatement technologies (generally in response to more demanding government-imposed emission standards) will lead to significant reduction per vehicle emission rates. This will not, however, automatically affect the equivalent reductions in total vehicle-related emissions.
· Greenhouse gas emissions (CO2 emission)
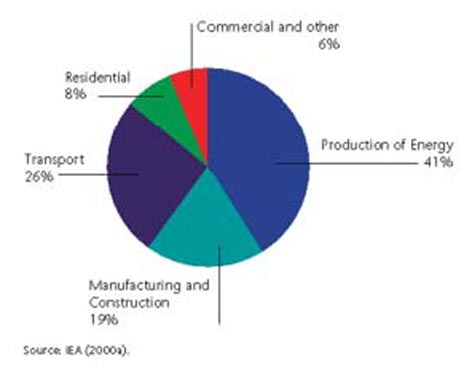
As far as the energy is concerned, the transport sector represents about 30% of total energy consumption in Europe, more than 20% of the early 1970s. Over 84% of energy consumption through transport goes to road transport. Fuel consumption from the vehicle fleet has hardly changed over the past twenty years - major developments in engine and vehicle technology have been more than neutralized by the increases in the fleet, congestion and increases in engine capacities. Increased energy consumption has led to a significant increase in CO2 emission by transport - 63% in the EU since the early 1970s. According to the latest trends, an additional 25% increase by the transport sector is forecast by the end of the century. This would represent 30% of total CO2 emissions in the EU compared to the figure of around 25% that we have today. It is estimated that urban traffic is responsible for almost half of the transport CO2 emissions.
Some other emissions from transportation — methane, nitrous oxide (N2O), and vehicle air-conditioning refrigerants — are also greenhouse gases. These gases have a much higher potential effect on climate change than CO2, although their atmospheric concentration is much smaller.
Figure 1. – Share of worldwide CO2 emission from the combustion of fuel,
by sector - 1998
· Health problems
Several studies point to the link between urban traffic and health damage. Swedish studies have uncovered that urban air pollution causes annually 300-2000 new cases of cancer. Traffic accounts for 70% of the emission of carcinogenic substances as well as of the substances that may affect the genes of people living in urban areas [22] . A British Government study found a link between emission particle levels and cardio-vascular diseases, and indicated that up to 10,000 people in England and Wales have been dying each year because of exhaust fumes [23] . Since it is difficult to find conclusive links, there is a widespread evidence of the effects that major transport emitted pollutants have on health [24] . This area calls for more research, especially in local communities.
· Noise pollution
Cars and trucks are major sources of noise pollution in most cities. The most developed countries have had vehicle noise emission regulations since the 1970s. Technological progress in engines and exhaust systems has made these vehicles considerably quieter.
The vehicle noise emission can be reduced by aerodynamic vehicle body designs (which also have the effect of improving fuel efficiency and reducing emissions). It can be reduced through tire tread designs and improvements in pavement surface textures (which also have the effect of removing water more effectively and thus reducing the risks of accident). Noise barriers can also minimize the impact of vehicle noise on the surrounding.
Road traffic is the main source of noise pollution. Air traffic is also important, but it affects a much smaller part of the population. The report Europe's Environment: The Dobris Assessment estimates that nearly 450 million people in Europe are exposed to noise levels of over 55 dB(A), while nearly 113 million people are exposed to more than 65 dB(A). These are the unacceptable noise levels that may lead to a damage of health [25] .
An example of a project designed to measure and tackle the impacts of transport on environment and health, is the trans-European project involving Kirklees, Berlin, Madeira and Copenhagen. The project, founded under the LIFE programme, is seeking to provide very detailed information about how transport effects air pollution, noise and health. Geographical information systems will be used to model transport scenarios for the year 2012.
3.3. (In)accessibility
Inaccessibility is an increasing problem in urban areas. In the majority of cities, there is a consistent trend towards decentralization of both people and their working places from inner to outer areas, regardless of whether the city is growing or diminishing. Locating the new development on green field sites in peripheral areas is a trend that creates longer journeys and additional traffic. It makes no difference for a car user, but to those dependent on other forms of transport it does. Such developments are often located in low-density areas, where the costs of providing satisfactory public transport are generally too high. The social implications of migration into suburbs developments would not be so extreme if local facilities were available within the cities. Problems arise when the expansion to green field sites is followed by the closing down of local services. The result is that some people are becoming more and more isolated from the services necessary for their everyday life.
Changing lifestyle is another factor which in itself causes car dependency on a higher level, and inaccessibility for those who cannot afford a car, or are not able to drive one. It seems logical that higher densities and mixed developments would increase accessibility.
Traffic congestion causes significant speed reductions in city traffic, leading to average speeds that have not been seen since the beginning of this century. A recent study found that traffic speed has been reduced by 10% in major OECD cities over the last twenty years. In one third of the surveyed cities the early morning speed in the city centres was below 19 km/h [26] .
Congestion increases polluting emissions and fuel consumption. Current speeds in many large cities are in the most inefficient area of the speed/fuel consumption curve. Congestion also affects public transport, making it even less attractive and less appealing to the potential users. Congestion, defined as 'additional time spent traveling compared with free-flowing travel' is estimated to cost about 2% of GDP [27] .
4. SUSTAINABLE MOBILITY
People desire mobility. They desire it both for their own sake and for the sake of their overcoming the distance between their homes and the places they work in, shops, medical centres, schools or the places of their friends and relatives. Business requires mobility as well for the sake of overcoming distance — the distance that separates manufacturers from the sources of raw materials, from the markets, and from the employees. However, mobility is also associated with a variety of negative impacts — congestion, pollution, greenhouse gas emissions, disruption of neighborhoods, noise, accidents, etc. Another concern is that the world’s current mobility systems rely almost exclusively on a single source of non-renewable energy, i. e. petroleum. The tension between the desire of humankind for mobility and its concern about the negative impacts associated with mobility raises the question of whether mobility is sustainable.
“Sustainable mobility” is a term that allows different meanings. The World Business Council for Sustainable Development defines “sustainable mobility” as “the ability to meet the needs of society to move freely, gain access, communicate, trade, and establish relationships without sacrificing other essential human or ecological values today or in the future.” This definition emphasizes the social aspects of mobility. But for many people the term "sustainable mobility” reflects more mundane concerns — concerns relating to whether the transportation systems on which our societies have become dependant can continue to function good enough to meet our future mobility needs.
Under different circumstances, different ways of transport offer different levels of mobility and accessibility. In urban settings, the car provides the highest level of accessibility. Car users do not have to accommodate their schedule. They can leave whenever they wish and they can usually choose the route to their destination.
Mobility also shapes our settlements. Today, two dominant phenomena are shaping the pattern of human settlement. The first is urbanization — the tendency of populations to concentrate in the cities. The second is decentralization — the tendency of these same urban areas to expand outwardly outside their current area. The expansion generally happens at rates faster than overall population growth, producing net declining in the population density of metropolitan areas. Neither of these phenomena could be happening without increased mobility. Mobility systems affect urban growth in an important way, because they make certain city areas more or less accessible, altering the terrain values and the attractiveness of area for various users.
If mobility is to be made sustainable by 2030 — the stated goal of the WBCSD member firms — the measures that will eventually produce the necessary changes must be undertaken almost immediately.
For mobility to be sustainable, accessibility must be improved and at the same time avoided disruptions in societal, environmental, and economic welfare which would more than equalize the benefits of the accessibility improvements. This means that any assessment of mobility’s sustainability must include not only a judgment in favour of its effectiveness when improving accessibility is concerned, but also a judgment in favour of the importance and consequence of any disruptions associated with social, environmental, or economic welfare.
One way of organizing the information required to make these judgments is to separate indicators into two categories: the measures that society would like to see increased and those that society would like to see reduced. An increase of these measures would reflect the success of a system in providing the important values associated with mobility — improving personal accessibility and enabling the business industry to provide consumers with affordable products and services. A decrease in these measures would reflect the success of a system in the mitigating trends that threaten societal, environmental, and economic welfare. These trends include climate change, resource exhaustion, congestion levels that obstruct productivity and threaten social stability, public health problems created by air pollution, ecosystem collapse, and others.
Mobility itself requires access, and this can be impeded by cost as well as by location. As it has already been noted, privately owned motor vehicles are typically the most flexible means of mobility. But in many parts of the world, the cost of purchasing, garaging, maintaining, and operating such vehicles is well beyond the means of the great part of the population. People must walk, use bicycles or two-wheeled motorized vehicles, or rely on various forms of public transport. Bicycles are limited in their range and the amount of weight they can carry. Two-wheeled motorized vehicles are less limited in both of these regards, but are still expensive. Public transport is generally less expensive in terms of the daily cost, but is often difficult to reach and provides relatively poor and inflexible service. Increasing access to flexible, affordable means of mobility can be achieved through improvements in any or all of these various dimensions. Reducing the cost of various types of motorized vehicles is one step further towards the improvement. Improving the flexibility and accessibility of public transport systems is the second step. Developing new transportation devices that combine flexibility with low cost is the third.
Personal mobility can be improved on an individual basis and in a rather short period of time. The tend of traveling by private car consumes more space and infrastructure per unit of travel than does traveling by public transport, though the validity of this broad generalization depends entirely on the passengers using the public transport. Full buses provide more efficient use of road infrastructure than cars do, and empty buses are less efficient.
With the incomes rising, the mobility demands of an increasingly large and more urban population are increasing. Over the last fifty years, data from all regions of the world demonstrate that travel (the average number of kilometers traveled by a single person per day) increases as consistently as income does — and income, no matter how unevenly it is distributed, is increasing all over the world. As income rises, people go on trips more and more, but for the reasons different than survival. For example, in the industrialized world, only 20-25% of all travel is now work-related. Another notable historical observation is that people travel further distances as their income rises, but the period of traveling does not last longer. On average, they spend roughly an hour a day traveling, regardless of distance. That means, of course, that people's choice shifts to faster means of transportation, from walking to bus, train or two- and three-wheeled vehicles, then to cars, and ultimately to high-speed trains and airplanes. Not only that this change to faster vehicles is more expensive but it also causes the consumption of more energy per passenger in terms of kilometers traveled. Almost all of the motorized vehicles (except for electrified trains) share one crucial characteristic: they are driven by a combustion engine. No other transportation power plant can match the compactness, cost, flexibility and reliability of the two widely used versions of this engine — the gasoline spark-ignition and the diesel compression-ignition engine. During the XX century, technical advances in the combustion engines, and the vehicles they power, have reached constant improvement in the performance, convenience, and safety of all motorized vehicles. Current trends suggest that these engines will continue to improve, forming a powerful competitive barrier for new technological participants to the marketplace.
The most significant factors increasing the demand for mobility in the twentieth century are the rapid growth of the population in the world, their constant migration into cities, and the decline in the population density (inhabitants per square kilometer) in these cities. The industrialized world has already been largely urbanized: about 75% of its population is currently concentrated in urban areas, and this portion is projected to increase to nearly 85% by 2030. As a contrast, only 40% of the population in the countries of the developing regions lives in urban areas, though there are regions that are highly urbanized — e.g., Latin America, where 75% of the population is urbanized [28] . By 2030, urban areas in the developing world are expected to house about 56% of the entire population of those regions. Globally, 60% of the world population is projected to reside in urban areas in 2030, which is much more than the approximate 47% in 2000. The consequence of these two trends — the process of urbanization, and its increasing concentration in the developing world — is most strikingly illustrated by the increase in the number of mega cities.
The broad patterns of travel behavior — increasing trip frequency, trip distance, and travel expenditure as incomes rise — become evident in the statistics of passenger transport all over the world. Between 1950 and 1997, the total number of kilometers traveled each year by a single person increased more than threefold. The total transportation system, adjusted to both the increase per capita and population increase, provided over eight times more passenger-kilometers in 1997 than in 1950.
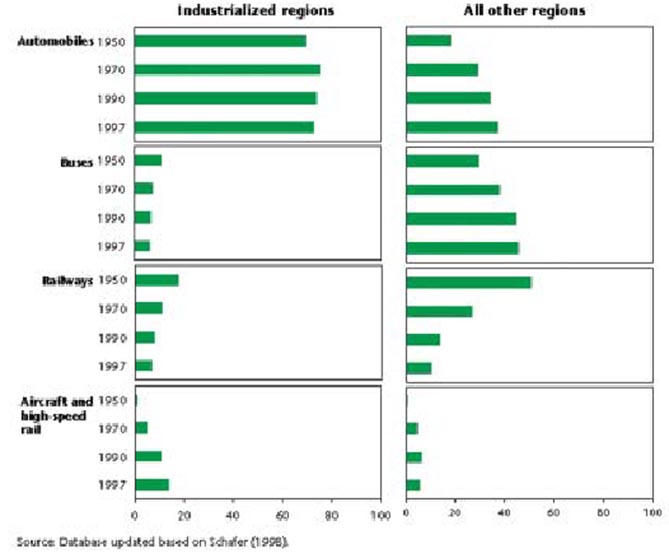
The average world growth rate of kilometers traveled annually has been rising at an impressive rate of 4.6% per year. The growth rate in some poor regions is even higher. China is just the example, with the growth rate of 9.4% per year, although from a generally adopted low base. Table 2. lists some statistics of growth, in both absolute and percentage terms, of all means of transportation over the 1950-1997 period. Total passenger travel in industrialized regions of the world is now approximately equal to total travel in all other regions; in 1950, it was almost four times as large. Non-developed countries surpassed the total-travel gap and would move ahead, perhaps notably ahead, in the future.
Table 2.- Growth in passenger-kilometars traveled

Although there is equality in total passenger-kilometres traveled, annual travel per capita is still about six times high in industrialized countries as it is elsewhere. In addition to overall growth measured by the distance traveled as a whole, there have been major shifts among means of transport. As people earn more and travel more, they use faster or more convenient (and less energy-efficient per passenger-kilometer) vehicles, i. e. cars in particular.
In that respect, rail travel is the one that loses the most. In fact, since 1950, the use of rail travel has decreased dramatically as compared to the total travel, especially in non-developed regions where it was the dominant form of motorized travel (see Figure 2). In industrialized regions over the last fifty years, cars accounted for an approximate stable 70-75% of the passenger-kilometers traveled. As a contrast, in non-developed regions, car travel rose from less than 20% on the whole in 1950 to about 40% of today, and that share is continuing to rise. Bus travel in industrialized regions have been steadily declining to a share lower than 10%, while in other regions it has risen to about 45% — providing for the preferred method of public transportation since the use of railway declined.
Figure 2. – Percentage shares of total passenger-kilometars traveled
Focusing on motorized transport makes it easy to forget that a part of the world’s population travels on foot or by bicycle. Walking or bicycling accounts for more than half of all trips made in a number of Indian cities, and 60-90% of all trips in many Chinese cities. In poorer rural areas, the dominance of non-motorized transport is even greater. Although approximately one-third of all “trips” are made on foot in OECD countries, the short trips (generally well below one kilometer) result in an almost insignificant traffic volume. Travel surveys suggest that walking accounts for less than 5% of total passenger-kilometers in Western European countries and merely 0.5% in the United States.
4.1 Mobility in the urbanized regions
In all urban areas of the developed world, the cars play the dominant role in providing urban mobility. Public transport is still very important, especially in Europe, but its share of total passenger-kilometres has been falling almost everywhere. Car ownership and use has substantially grown over the last fifty years. This, in turn, has caused the decline of average population density in urban areas, further damaging public transport’s competitiveness. Technology has enabled some reduction in the total transportation-related emissions of carbon monoxide, sulfur dioxide, and volatile organic compounds. However, slow fleet turnover, lack of proper maintenance, changes in the mix of light-duty vehicles, and increased driving has kept the reduction of total emissions well below the reduction of new vehicle emissions. Transport-related emissions of carbon dioxide have not declined. Improvements in fuel efficiency of new vehicles have been more than neutralized by increases in the total number of vehicles, changes in vehicle mix, and increases in vehicle utilization. Accident rates have decreased since vehicles and roads have been improved. Congestion appears to be increasing, though the actually comparable cross-national data on congestion are difficult to find. A range of strategies is being tried in different urban areas to offset the adverse impacts of motor vehicles. These include restrictions for using the car in the centre of the city, traffic “calming”, the promotion of carpooling, and various approaches to promoting the increased use of public transportation. Technology guides us how to increase the capacity of existing highway infrastructure, and the interest in the use of congestion charges and pollution charges seems to be growing.
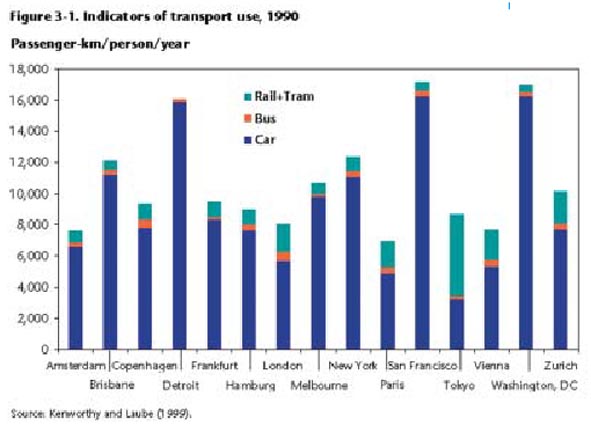
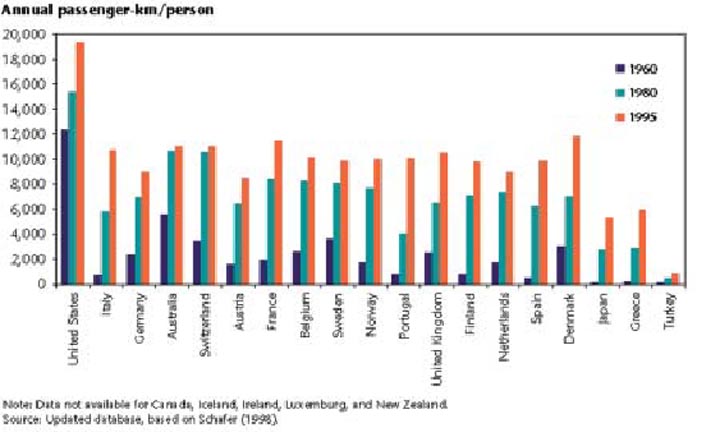
Figure 3 provides an overview of the contribution of the major modes of transport to mobility through a selection of cities across the developed world. It clearly indicates the dominant role of the cars in providing urban mobility. In the developed world, the private vehicle has become the most common form of motorized transportation, accounting for about 40% of passenger-kilometers traveled in Tokyo and over 95% of passenger-kilometers traveled in the cities of the United States. Public transport plays a smaller part in these countries, despite the fact that it is a very significant and important way of transport, especially in Europe and Japan.
Figure 3. - Indicators of transport use, 1990
Combining complete route and schedule flexibility with comfort, privacy, and speed, a car symbolizes to their users a very high level of mobility, significantly superior to that offered by any competitive means of transport. In the decades following World War II, rising incomes and the widespread availability of affordable cars produced sudden increases in the number of cars owners in the cities of the developed world. However, as Figure 4 shows, car ownership levels are high all across the developed world, and have been rising steadily in the last four decades. Further more, as Figure 5 shows, car use, as defined by annual passenger-kilometers traveled per person, is also high and has been increasing across the entire developed world.
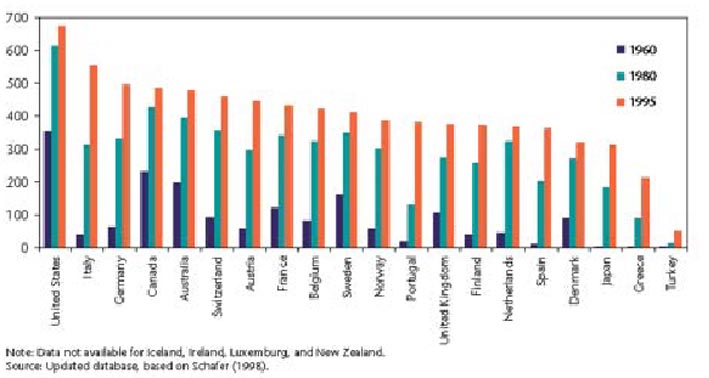
Figure 5. - Use of passenger cars in OECD countries, 1960-1995
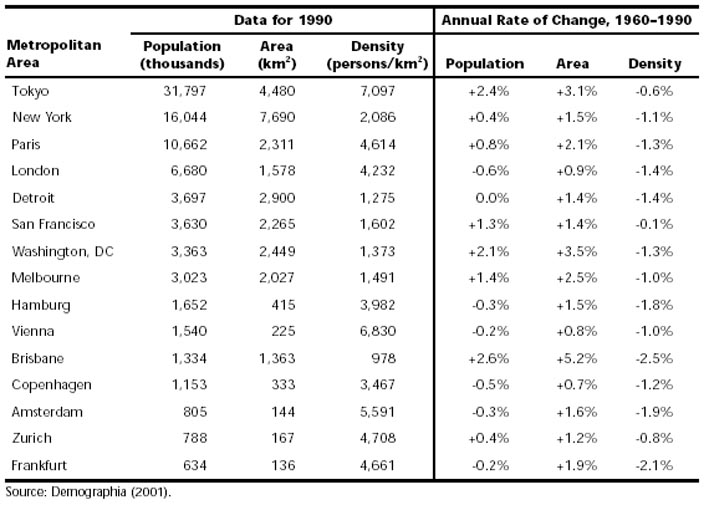
The rise in cars ownership and car use is deeply intertwined with the growth of suburbs around the cities of the developed world after World War II. Table 3 shows in detail the population shifts in a number of cities as residential suburbs flourished and inner-city neighborhoods diminished.
Table 3. - The growth of selected metropolitan areas, 1960-1990
Urban residents, who were seeking more space and privacy, began to move to the suburbs as soon as urban train systems made traveling accessible, faster and more efficient. Having been initiated in London in the 1850s and spread across Europe, the new train systems that shifted population out of the urban core were widely followed. By the early twentieth century, “streetcar suburbs” were widespread as people sought to leave the crowded, noisy, improper, and frequently unhealthy housing conditions of the inner city for cheaper housing in a more peaceful surrounding. In the early 1900s, the fixed patterns and limited capacities of the street railways limited the expansion of suburbs, but the growth of car ownership, and the suburban road networks built to accommodate it, accelerated the growth of suburbs dramatically.
The suburban migration was reinforced in some countries by national policies encouraging home ownership. As people moved to the suburbs, their employers and retail merchants followed. Cheap land was also a factor in drawing different types of business to the suburbs, where they could easily offer adequate and free parking. In an environment characterized by the widespread car ownership, public transport accessibility is no longer a significant factor in the location decisions of these firms. The dispersal of residences and jobs affected the geographic pattern of travel demands. Instead of the very high-density commuting flows between a limited number of areas (a “few-to-few” pattern of trips from the suburbs to downtown) that characterized urban areas in the early twentieth century, there is an increased number of scattered trips between many geographically dispersed origins. And this is the case for all kinds of trips, not only the journey to work. Non-work travel (shopping, personal or family business, recreation, etc.) is also likely to involve destinations that are geographically dispersed in the urban peripheries and the core. They thus require either individual trips towards scattered locations or complex trip chains that serve many purposes with only one trip. Conventional public transport is not efficient for the purpose of these kinds of trips and travel patterns.
The forces of urban decentralization are at work in Europe as well. Between 1970 and 1990, the part of metropolitan population living in the central city has declined in virtually every European city. It went down from 32% to 23% in Paris; from 41% to 38% in London; from 38% to 30% in Zurich; and from 80% to 67% in Amsterdam. Such declines occurred despite the fact that local governments in Europe have more control over land use, that public transport service is far more extensive, and suburban home ownership is not subsidized by the tax code. A striking example of an exodus to the suburbs is the former East Germany, where people are moving out of central cities in crowds, as incomes and car ownership rise. In Leipzig, a city of 500,0000 people, about 20% of city apartments are vacant, their owners having chosen to move to the suburbs — an option that was denied to them during the communist regime. Europe’s middle class has moved to the suburbs — where they shop in malls, live in low-density subdivisions, and drive on traffic-clogged highways. The city as a compact urban area with clearly defined boundaries is a thing of the past in Europe. In the absence of major economic upheavals, the trends described above — those of urban decentralization and increased auto mobility — are likely to continue in the foreseeable future. Where the market is mature and car ownership levels are already high, growth in demand for cars has become steady and consists primarily of replacement vehicles and additions of second and third car to the household. However, there appears to be no similar leveling-off in the growth of travel demand. Because of the declining urban densities and a dispersal of travel origins and destinations, cars are being used more intensively, i.e. for more trips and for greater distances. Between 1970 and 2000, urban car travel per capita increased by 30% to 35% per decade in Europe (see Figure above). With rising incomes, car use is expected to continue to increase, as our society becomes ever more mobile. Future growth of the car travel per capita is expected to be especially announced in metropolitan areas, whose outward boundaries continue to expand, and whose declining population densities and increasingly dispersed travel patterns exclude an extensive use of alternative means of transportation. According to OECD forecasts, vehicle kilometers of travel [29] in OECD countries are expected to grow over the next two decades (2000–2020) at a rate of 2% per year [30] .
4.2. The Role of Public Transport
Public transport is an important means of mobility in the larger and denser urban settlements. But its role has been decreasing in most cities of the developed world on a grand scale as a result of the trends toward auto mobility and sub-urbanization discussed above. Buses are the most important means of local public transport in Europe.
In the European Union, public transport use has grown by 40% since 1970, though the population it serves grew by only 10%. Western Europeans therefore use public transport today more than in 1970, with buses far ahead than all the others, then rail and urban rail. Private vehicle use has grown even more markedly, but as a consequence, public transport’s share of total trips has fallen from 22% to 14%.
Across most of the EU, public institutions manage local public transport. Sometimes the government provides a public transport system on its own initiative, and in other cases the public sector takes over the financially troubled private operators. In France, local public transport services (outside of Paris, Marseilles, and few other cities) have long been provided by private operators authorized by local government agencies. In recent years the rest of Europe has begun to emulate the French example, and the privatization of public transport is expanding rapidly. The degree of privatization, and whether it extends to both train and bus systems, varies widely among different countries. In the United Kingdom, outside London, bus services are fully unregulated, with the public sector's role restricted to ensuring the provision of services which were assessed as socially necessary. But the more general model for bus operations is for a public-sector client to specify the service requirement and then acquire this competitiveness from private operators. Securing private competition for rail transport is more difficult, but it has been achieved in Sweden and the United Kingdom. The evidence regarding the success of privatization efforts so far is mixed. In most cases, costs to the public fund have been reduced. In some cases, service levels have also improved, but there are evident examples in the favour of the opposite. Surely the effects have not been uniform, and concerns relating to safety and long-term economic viability remain.
4.3. Non-motorized Transport (NMT)
In almost all cities, walking is the most common mode of transport for distances not longer than 1 kilometer or so. In gentle terrain, bicycling is principally agreed to be a competitive mode for distances up to 5 kilometers or more; however, bicycle usage varies considerably from city to city. Figure 6 shows data for a number of European cities that suggest that walking and bicycling together account for a significant share of total trips in a number of cities.
Figure 6. - The role of non-motorized transport in selected European cities
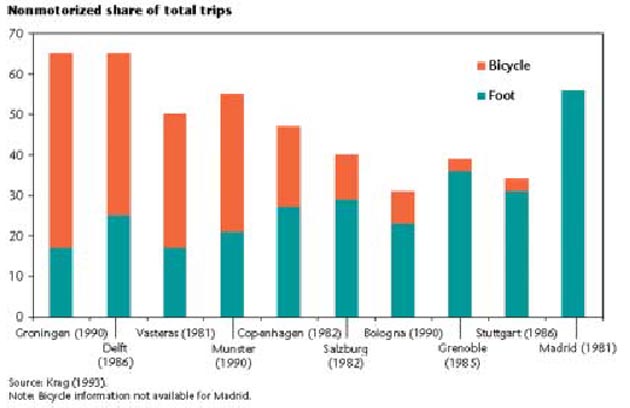
There are many reasons for the various popularities of walking and bicycling. Some of the differences can be attributed to local topography and climate, but tradition and culture play a significant role as well, as transport and land-use policy also do.
4.4. Mitigating strategies
Every industrialized nation has worked hard to develop policies to mitigate the opposing effects of motorization, without diminishing the continued growth of mobility. The mitigating strategies can be classified into five broad categories:
(1) reducing the demand for car use;
(2) improving the provision of highway and public transport infrastructure;
(3) improving the transport options available for travelers;
(4) using innovative land-use and urban-design strategies to reduce travel demand;
(5) using integrated approaches that combine multiple strategies.
Each of these broad categories includes multiple strategies. For instance, the demand for car use can be reduced in a number of ways: the price of cars could reduce the demand of such; more environmentally sound paradigms of vehicles could be encouraged; car use can be restricted. Similarly, improvements could include building new infrastructure, as well as operating and managing existing infrastructure more efficiently.
(1) Reducing the Demand for Car Use
Over the last three decades, the negative effects of cars have incited the creation of several strategies to improve these effects by reducing the demand for car travel. They include direct restrictions on car use as well as a number of innovative ideas that are more nuanced in their approach.
¨ Transportation Demand Management. Transportation Demand Management (TDM) is a set of techniques that aim to reduce or redistribute travel demand, reduce solo driving, and decrease car dependency. Typical TDM techniques include promotion of carpooling, flexible working arrangements, telecommuting, road pricing, and timesaving high-occupancy vehicle (HOV) lanes. In recent years, metropolitan regions in several EU countries have adopted TDM as part of their transportation plans.
¨ City centre car restrictions. Car restrictions have won acceptance as a legitimate technique of congestion management and as an instrument of achieving sustainable mobility in crowded city centers. They are employed in more than 100 cities of Europe, North and South America, and Asia as documented by OECD surveys [31] . Center-city restrictions vary in duration, scope, and severity, ranging from temporary traffic prohibitions in commercial districts during shopping hours to permanent closure of vehicular traffic in entire historic town centers (“car-free zones”), as in Vienna, Austria; Munich and Bremen, Germany; and Bologna and Turin, Italy.
¨ Traffic calming. In residential areas, there is a variety of regulatory and physical “traffic-calming” measures used to slow down and discourage through-traffic. The roots of the movement to reduce or “calm” vehicular traffic can be traced to Europe, where concern about traffic and the political will to act upon it surfaced in the early 1970s. The Netherlands pioneered the concept of the Woonerf — protected residential areas in which pedestrians had absolute priority over vehicular traffic. Cities in Germany also introduced the concept of Verkehrsberuhigung — a policy which limits the use of cars in residential areas using an array of techniques, such as diverting through-traffic, limiting parking in specified areas installing physical speed-restraints and declaring certain areas that are off-limits to the cars.
¨ Car-sharing: Separating ownership from use. Renting cars on a short-term basis, in other words known as “car sharing,” is another strategy aimed at reducing the impact of cars on cities. Car sharing gives urban residents access to cars without requiring them to own one. This concept works because members of car-sharing organizations do not depend on cars for everyday use. The typical member of a car cooperative is a young, single, city dweller who needs personal transportation only sporadically. Car-sharing projects can generally be divided into three types: single-port systems (where users return the vehicle to the place where it came from), dual-port systems (to exchange between two stations), and multi-port systems (where the user can leave the car in each of these ports). Most of the existing car-sharing cooperatives are single-port systems. Multi-port systems remain technically challenging to implement because of the difficulty associated with keeping the vehicle offer in balance in various ports which have different demands when time and location are concerned. Auto cooperatives have been multiplying rapidly in Switzerland, Germany, Austria, and the Netherlands. Car sharing is an interesting and innovative experiment and it is not currently expected to make a large reduction in the demand for personal cars in the industrialized countries. A study, commissioned by the Swiss energy office, estimates a potential market for car sharing of not more than 1.5% of the driving population [32] .
¨ Fuel taxes: Pricing car use appropriately. Appropriate pricing of the car as a tool toward achieving sustainability is a long-cherished goal of many economists. They argue that sustainability concerns arise because car users capture all of the benefits of their trips, but pay only a fraction of the costs. In particular, drivers do not pay the damage for the pollution, noise, and CO2 they produce, the congestion delays they impose on other travelers, or the risks of accidents associated with their driving. Economists theorize that if drivers were asked to pay these costs through appropriate ownership and use charges, they would be more prudent in their travel choices. Lower and more sustainable levels of car use on the whole would follow as a consequence. Economists promote fuel taxes as a good (though not perfect) alternative for a “use charge" and therefore, for various pollutant emissions. The theory is that higher gas taxes influence consumer behavior in a multiple complex ways. In the short term, consumers react by reducing car use. The empirical evidence suggests that short-term effect is relatively minor — a 10% increase in fuel price translates to a 2-3% reduction in total car travel [33] . However, such car use differences probably understate the total impact of fuel taxes on sustainability. As the cost of gasoline consumption increases, consumers buy smaller cars, more fuel-efficient cars and thus reduce their gasoline consumption per kilometer traveled and organize their lives (and the places where they live) in such a way that it does not require much driving. Furthermore, organizing the lifestyle in a way that it requires less driving, produces more compact suburbs and cities. It is true, empirical analyses of the effects of price on gasoline consumption in the OECD countries, indicate that price increase has a very significant effect on gasoline consumption (and consequently on CO2 emissions). The range of estimations varies significantly through studies and across different countries. The evidence suggests that a 10% increase in gasoline price has the effect of reducing total gasoline consumption by 6-8% and as a consequence, the consumers are gradually choosing not to use relatively fuel-efficient cars that much [34] . In most European countries, fuel taxes are already very high, and increasing them even more would meet with general disapproval.
¨ Congestion pricing. Congestion pricing or peak-period pricing, is a specific pricing scheme that charges car users with compensation for using the road when its capacity is reduced, i. e. during rush hours. The efforts to introduce congestion pricing more widely have, so far, reached only limited success. Until recently, the technology presented an obstacle. The technologies that were needed to implement efficient tolling on high speed and high-capacity roadways have become available only in the last decade. Furthermore, for a number of reasons, citizens and the politicians in most places have opposed the use of pricing for the benefit of restricting driving during rush hour. Congestion-pricing initiatives in Sweden and the Netherlands have likewise met with disagreement. An attempt to implement a congestion-pricing scheme in London has also met with significant disapproval. Nonetheless, there are some indications that the future of congestion pricing is likely to be brighter than the past. Firstly, technology is no longer an obstacle; the development and widespread experience with advanced electronic fare collection mechanisms makes the actual implementation of a congestion-pricing program relatively simpler. Secondly, recently there have been some experiences according to which congestion-pricing schemes have been successfully introduced without much opposing. Politically, the best prospects for wider adoption of this strategy appear to be in connection with the introduction of new roadway facilities, where the tolled facility offers a high level of service alternative to older, unpriced, competitive facilities.
(2) Introducing innovations to increase the operational and economic efficiency of public transport.
There is a number of initiatives that promise the increase of operational and economic efficiency of public transport systems. Some are based on technological developments, such as the use of smart cards; some on the development of real-time passenger information systems that immediately inform passengers of the delay in the system’s extensive use of automatic bus location systems based on Global Positioning Satellites (GPS-based). The others are based on dynamic scheduling and routing of para-transit to meet excess demand or make up for delays. Still, other innovative operational initiatives include door-to-door public transportation service. Other initiatives involve more vigorous and imaginative management by public authorities and institutions. These initiatives include an increase in track sharing, i. e. joint use of mainline rail lines by intercity, regional, and municipal public transport systemwide; regional integration of public transport schedules and fares; the development of regional transportation associations. Among the most important global trends in public transport management are efforts to improve the economic viability and efficiency of public transport by putting the operation of public transportation systems into the hands of the private sector. Known in its various forms as a deregulation, privatization, outsourcing, contracting, franchising or competitive tendering, it always aims for the same thing: to improve the service quality and performance of public transport by adding competition and entrepreneurial approaches into delivery service.
(3) Improving the Available Transport Options
Planners suggest two strategies to facilitate sustainable mobility in the category of improving the available transport options. Firstly, to reduce car dependency by increasing non-car transport options. Secondly, to provide mobility and accessibility options for those who do not have access to cars.
¨ Provision of public transport. In the last three decades, the cities of the developed world have significantly improved their public transport. In the EU, the bus and coach fleet has steadily grown and is now 50% larger than in 1970. There has also been an expansion in urban rail in the last quarter of the XX century, with new systems constructed in a number of European cities. Although these improvements in the provision of public transport have been accompanied in most cases by increases in absolute levels of patronage, public transport's share of total trips and total kilometers traveled has actually declined almost in the entire developed world during this period.
¨ Improving non-motorized transport (NMT). Among the EU countries, Denmark and the Netherlands are the leaders in promoting NMT. Dutch Traffic and Transport Structure Scheme (SVV2), covering the period from 1990–2001, identifies the bicycle as the ideal means for trips of up to 5–10 kilometers. In fact, 40% of all car trips in the Netherlands are less than 5 kilometers long.
At the same time, the SVV2 recognizes a number of issues associated with bicycle use, including the need to provide direct, safe, and attractive bicycle routes between residences and trip destinations; the need to provide bicycle parking facilities; and the problems of safety and bicycle thefts. Within the framework of the SVV2, the government developed a national Bike Master Plan (BMP), according to the data from 1990–1997, to promote and improve bicycle use. Roughly 575 million guilders (US$230 million) were spent by central, provincial or local government on bicycle projects. Despite this substantial public investment, BMP research concluded that bicycle policy alone was not sufficient to increase bicycle use and restrain growth in car use [35] . Denmark has some of the most aggressive pro-NMT policies in the world. Copenhagen has approximately 300 kilometers of separated bicycle tracks, which is about half the total length of the city’s road network. Bicycles are given priority over motorized vehicles at intersections, and a public education program includes a “culture of respect” for pedestrians and bicyclists by drivers. Such initiatives have resulted [36] in Copenhagen’s having one of the lowest rates of transportation-related fatal accidents per person in the world (1.3 deaths or serious injuries per year per thousand residents). Copenhagen also runs a City Bike Program, which in 1997 provided roughly 2,500 free bikes at key locations around the city. The bikes are refunded by advertising, and are maintained by the Municipality, with the help of the prison inmates. There are plans to increase the number of bikes in the program. Copenhagen has also taken measures to make the use of cars undesirable. For example, it has reduced the availability of parking and converted streets to pedestrian zones. At the national level, car ownership in Denmark is discouraged through very high vehicle registration fees (105-180% of the vehicle purchase price), although the gasoline tax is in the middle of the range of European rates. Roughly, one-third of the city’s home-to-work trips are made by bicycle [37] .
¨ Providing transport options for those without cars. There are many programs and policies to provide mobility for those without access to car. Effective solutions frequently focus on particular groups, such as the poor, those with disabilities, or the elderly. Policymakers particularly focus on three kinds of strategies:
- Ensuring that mainline public transport services are sensitive to the needs of those without access to cars. Agencies often provide minimum levels of public transport service apart from rush hour, to ensure that service is available or, even when such service would not be justified on strict economic grounds.
- Para-transit services. In several regions, there are trips that conventional public transport is unable to provide. In many cases, local authorities provide demand-responsive para-transit services in order to help people with special needs. Such programs are often targeted at the disabled and the elderly. These services have both advantages and disadvantages, depending on conventional public transport. Being demand-responsive and door-to-door, they often offer a high level of service, and as a result there is disagreement about what constitutes fair and efficient pricing for the service. On the other hand, these services usually require significant planning in advance. Moreover, many disabled citizens argue that, for dignity's sake, they deserve to be integrated with mainstream society as much as possible, and being able to use public transport is an important element towards this goal. Many disabled citizens and their advocates condemn targeted para-transit services — even those offering higher levels of service than conventional public transport — as humiliating.
- Direct user-side subsidies to help those without cars to either get them (when the poor are concerned) or buy alternative transport services (such as taxi service) directly.
(4) Land-Use and Urban Design Strategies
In the last three decades, some urban regions in the developed world have successfully employed land-use policy to facilitate a pattern of development by which public transport can play a significant mobility role, and limit sprawl. This policy encourages residential, employment, and recreation buildings to cluster around rail public transport stations. The goal is to build compact, pedestrian-friendly communities where many trips could be made on foot or by bicycle, and train could make longer trips. This approach has been followed widely and successfully in Europe. Examples include Stockholm’s satellite towns situated along travel rail lines which spread from the city; French "villes nouvelles" on the outskirts of Paris and German transit-oriented suburban communities such as Munich’s Perlach and Frankfurt’s Neustadt.
The Netherlands, one of the smallest developed nations in Europe, has a comprehensive approach to land-use planning - the ABC policy. Dutch planning focuses not only on restricting traffic growth and urban sprawl, but also on developing compact cities and protecting open areas. ABC explicitly seeks to reduce auto mobility through programs such as the one summarized in its slogan for business location: “the right business in the right place”. The ABC policy classifies businesses into three categories based on the importance of their need for public access and road transport. Business development sites are classified in the similar way, in terms of their public transport and road accessibility. The policy attempts to encourage business with a large number of employees and visitors which is located on sites with good public transport accessibility, such as near centrally located public transport or rail stations (“A” sites) or near major public transport modes in less central locations (“B” sites). “C” sites, with good road access, are primarily intended for the business that depends on road transport for its operations. Associated with each type of site are restrictions on the number of parking spaces that can be provided there: “A” sites are limited to 10 to 20 parking spaces per 100 employees and “B” sites to 20 to 40 parking spaces per 100 employees. These rules are restrictive enough, and as a result the businessmen have a strong objective to locate their business in accordance to the intentions of the policy. All in all, the Dutch accept the ABC policy, though objections to the highly restrictive parking limits, along with economic pressures at the local or provincial levels, have led to loosening parking rules in some areas of the country.
(5) Integrated Approaches
The most successful examples of cities controlling auto mobility and improving the sustainability of their transport system use combinations of the policy options above. Isolated policy responses are not likely to have a significant impact. Copenhagen, for example, combined public transport-oriented land-use planning, high car ownership charges, priority treatment of bicycles, and numerous improvements to city center social life. Zurich upgraded its tramways into a modern, high quality, and reliable public transport system operating on separate rights-of-way, obtained by removing traffic lanes from general use. A computer-based signaling system ensures that trams do not have to stop at intersections. Intensive marketing and information campaigns promote the use of the tram system, and special maps show people how to get to particular destinations such as restaurants and cultural attractions via the public transport system. These public transport system improvements were accompanied by corresponding land-use and urban improvement policies. Large shopping centers were built around major stations.
[1] World Commission on Environment and Development, 1987, p. 43
[2] 1994
[3] CEC, 1992c
[4] CEC, 1992b
[5] CEC, 1992a
[6] CEC, 1995b
[7] CEC, 1996b
[8] CEC, 1992e
[9] ICLEI
[10] WHO, 1993
[11] UNCHS, 1990
[12] ICLEI
[13] World Bank, 1993
[14] OECD, 1990
[15] UNCED
[16] CEC, 1994c
[17] CSD
[18] 1993
[19] 28.2.c
[20] 28.2.a
[21] Regions and Cities for Europe
[22] Ministry of Environment and Natural Resources, 1992, cited in OECD/ECMT, 1995
[23] Brown, 1994, cited in OECD/ECMT, 1995
[24] TEST, 1991
[25] EEA, 1995a
[26] OECD/ECMT, 1995
[27] Quinet, 1994, cited in OECD/ECMT, 1995
[28] UN 2001
[29] VKT
[30] OECD 1995a, chap. 3
[31] OECD 1984
[32] Hormandinger 1997
[33] Graham and Glaister 2001
[34] Graham and Glaister 2001
[35] ECMT 2001
[36] EU 2001
[37] Newman and Kenworthy 1999